


One of the most powerful tool Salesforce users have their hand on is the Salesforce Reporting feature. This helps users get different views on their data, reports and analytics helping admins demonstrate the value Salesforce has on the organizations productivity and efficiency. Lightning report builder, a drag and drop interface, helps in building reports and is extremely effective because the trick is that all Salesforce admins should have a solid idea of all the options available to them on their plate when writing up reports. So, this is just the basics of things. It does get more advanced than this.
What are the advanced reporting features in Salesforce? Well, long story short, they are a list full of tricks Salesforce power users should know to create reports the users need. Making reports even with challenging data models is made easier and produces more efficient and scalable work with minimal additional configuration.
So, let’s look at in detail the advanced reporting options that Salesforce CRM offers. If you are new in creating reports in Salesforce, then you have come to the right place.
Salesforce Advanced Reporting Features
1. Custom Report Types
Salesforce has built in report types that are out of the box for all standard objects and standard object relationships. An example could be “Contacts & Accounts” or “Opportunities with products” where you can also view a list of report types when creating a new report. What’s better is that this is the same case even when you are building custom objects, Salesforce automatically creates report types here too. Report types have 2 kinds of relationships either “with” or “and” depending on whether the two objects have a lookup or master detail relationship with one another. This is just the basics of report building, you may want to go beyond standard and auto-created report types in cases of when you need to report on more than 2 objects at one time or when you have to report on “without” relationships (not just “with”)
This is where custom report types come in. Let’s look at the high level steps to create a custom report type:
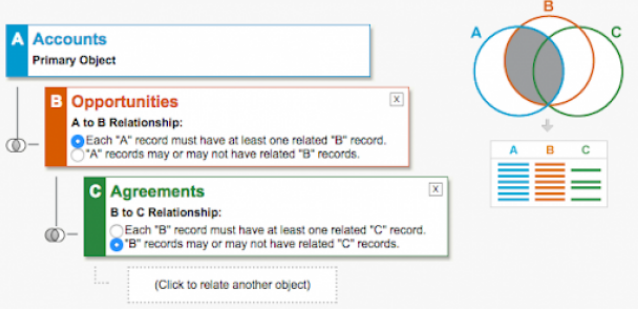
Step 1: Select all the objects you would like to include in your report.
Step 2: You will then select a primary object (in the case above it would be Accounts) and then wizard will show you a list of all the child objects. You can then add up to 4 grandchild objects in your report as well.
Step 3: You can then specify whether the object selected has to have related records to show up in the report, which is useful when you want to show a report like Accounts with & without opportunities.
2. Cross Filters (Exception Reports)
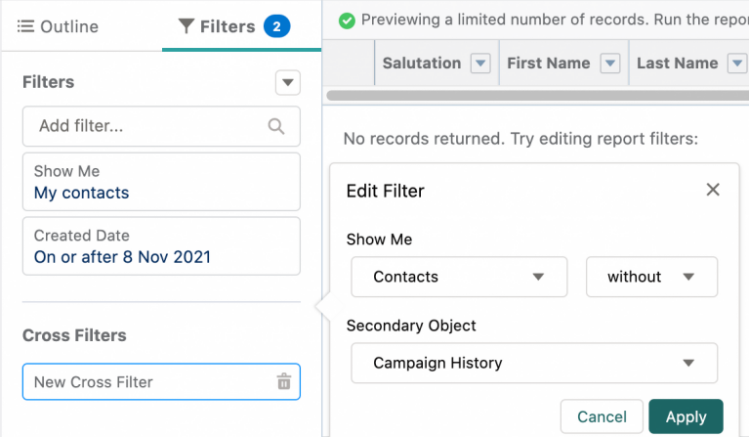
When it comes to filtering reports you might want to retrieve records with or without certain related records. If we continue with the last example of Accounts & Contacts, then you might want to identify accounts with executive contacts or opportunities without any activities in the past week. That is where cross filters help, enabling you to find where data does not exist, also called an exception report. In the report builder, cross filters are added like all other filters are but with extra options. The format is as follows:
Show me — [primary object] — with/without — [related object]
Example: Show me — Contacts — without — Campaign History
You can also take cross filters to the next level by adding additional filters. Once you have selected the objects an additional filter box appears, this is where you add sub-filters to narrow down the related records even further.
Example: Show me — Contacts — without — Activities — with status: “open”. This will pull a report with all contacts that have no open activities.
3. Summary Formula
Summary Formulas can handle complex calculations at all summary levels, acting like fields once formulas are created. Hence, they are referred to as Summary formula columns in Salesforce lightning. Let’s walk through the steps of putting these reporting features into context:
Step 1: You start with adding a number field to the report canvas.
Step 2: Open up the collapsed “Fields” left sidebar. You’ll see “Summary Formulas” as a section.
Example: Maybe you want to find out how much each account is contributing to the pipeline for each specific opportunity “type”. You want to know which account is driving the greatest share and which is contributing the less.
Step 3: Search for, and insert fields and functions to the left.
Example: You use PARENTGROUPVAL, which allows you to “grab” a previous grouping in the report (the total revenue for the Opportunity “Type”) and then helps you use it to calculate your percentage at the Account level.
Step 4: Make sure you have selected the correct “Display” setting (you will receive an error if it’s not the correct option)
Step 5: Once you have made sure you have validated and applied your formula, the formula will appear in the form of a column (furthest right column in the report)
Salesforce Services Rolustech Offers
[wptb id=32056]
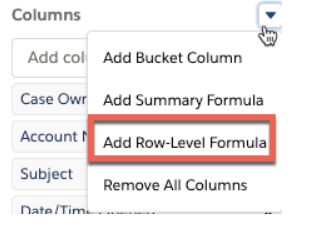
4. Row-level Formulas
So, first things first are understanding that Summary formulas and Row-level formulas are two different things. They may sound similar but are actually distinct from one another. Row-Level Formulas are applied to a single record and are displayed on the row itself.
Example: Suppose you want to check if two fields on the same record have the same value.
5. Historical Trend Report
Whenever you are reporting, snapshots capture a data overview at specific moments in time. Salesforce trend reports are designed in a way to glance back at historical field values on a given date. This makes tracking more targeted, meaning you have so much data captures for you to find out the value on a specific date, on demand. That is incredible. There are however, limits to the objects and fields you can track with historical trend reporting. They include firstly, reports only being available for opportunities, forecasting items and 3 custom objects. Secondly, only being able to choose 8 fields per object. Finally, 5/8 opportunity fields are pre-selected and all 8 forecasting fields are pre-selected.
Example: Show the value amount in my opportunities account in w/c on 23/05/2021.
6. Field to Field Filters
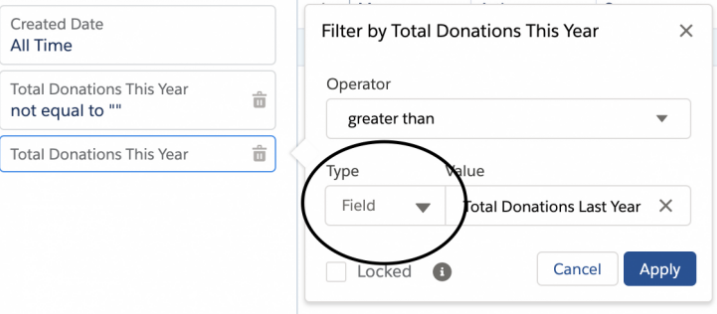
Field to field filters are helpful when you want to compare values in different fields on a Salesforce report, when defining your report filter criteria.
Example: Say you want to see different contacts with value donations this year greater than last year.
7. Stacked Summaries
Stacked summaries summarize a large amount of data for a quicker review and comparison. This view is automatically activated when you add fields to both the rows and columns. These can be easily switched on and off at the bottom of the report builder.
Example: Say you want to see the number of Opportunities by account, by Opportunity Type. Clicking on one cell of the Stacked Summaries view will filter the report that are below it.
8. Report URL Hack
So, this is not exactly a feature but you can consider it a hack that will help advance your reporting skills. URL hacking parses over URL parameters to set values for filters and fields which is currently supported in Lightning experience. Reports URL hacking means users are able to open reports with filters that have been set through URL parameters. This helps avoid repetition, the need to clone or have multiple reports. All URL parameters are dynamic and set automatically according to the record data the user is viewing.
Example: You want to launch an Opportunities report from an Account record, that only shows Opportunities related to that specific Account.
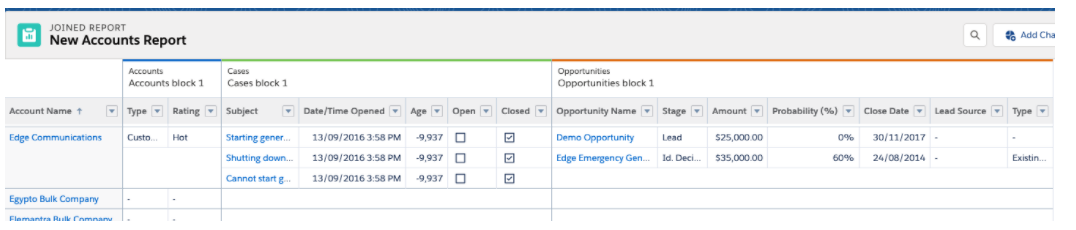
9. Joined Reports
The name explains it all already, a joined report is a combination of two reports that have different report types within a single view. They appear like they are one single report, allowing you keep a holistic view of things. Adding report “blocks” and defines filters for each report.
Example: Say you want to see all account details in block 1, related cases in block 2 and then related opportunities in block 3.
10. Reporting Snapshots
Reporting Snapshots allow you to take a picture of a set of Salesforce records and freeze the data on them for future references.
It’s a Wrap
Everyone knows the basics, but knowing about the Advanced reporting features in Salesforce is the real game. First, get to know what they are and how they work and then start implementing them in your business. These are the tricks Salesforce power-users use to ultimately create the reports users need, without letting challenging data models get in the way. That is where you will need good Salesforce consultants to help up your game.
Give these 10 features a test drive in your business and let us know what you find!
Rolustech is an Official Salesforce Partner firm and has completed several projects in Salesforce Integration, Salesforce Customization, Salesforce Implementation, and more. Get in touch now for a FREE Business Analysis. We will be glad to assist you!

